A graphic scale, sometimes called a bar scale, is a visual tool used on maps, site plans, engineering drawings, and architectural layouts to show the relationship between distances on the map and distances in the real world. Unlike written scales that rely on ratios or text, a graphic scale presents distance in a clear, visual format that remains accurate even when a document is resized or reproduced.
Understanding how to read a graphic scale is essential for anyone working with maps or plans, including surveyors, engineers, and landowners. It allows you to measure distances accurately, interpret spatial relationships correctly, and avoid costly mistakes caused by miscalculations.
This article will explain what a graphic scale is, how to read it step by step, and how to avoid common errors.
Basics of a Graphic Scale and Its Purpose
A graphic scale is a line or bar divided into equal segments, with each segment representing a specific real-world distance. These scales are typically printed near the edge of a map or drawing and are labeled with units such as feet, meters, miles, or kilometers.
The primary purpose of a graphic scale is to provide a direct visual reference for distance. Because it scales proportionally with the map or drawing, it remains accurate even if the document is enlarged, reduced, or copied. This makes it more reliable than ratio scales such as “1:24,000,” which only work correctly at the original printed size.
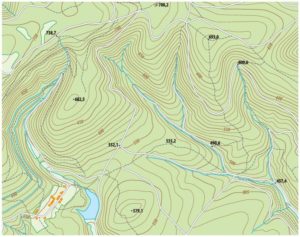
Graphic scales are especially useful on topographic maps, subdivision plats, construction plans, and educational maps. They help users quickly understand distance relationships without requiring calculations.
Understanding Units and Divisions on a Graphic Scale
To read a graphic scale correctly, you must first identify the units of measurement being used. These are usually printed below or above the scale bar and may include feet, meters, miles, kilometers, or a combination of units depending on the map’s purpose.
Graphic scales are divided into major divisions and minor subdivisions. Major divisions represent larger, whole-unit distances, such as 100 feet or 1 kilometer. Minor subdivisions break those units into smaller increments, allowing for more precise measurement.
Often, the zero point is located slightly inside the scale rather than at the end. This design allows users to measure partial distances more accurately. Understanding how to read both labeled and unlabeled segments ensures you can estimate distances correctly without guessing or rounding improperly.
Step-by-Step Process for Reading a Graphic Scale
1) Reading a graphic scale is a straightforward process when done methodically:
2) Identify the scale and units – Confirm what units are being used and the value of each division.
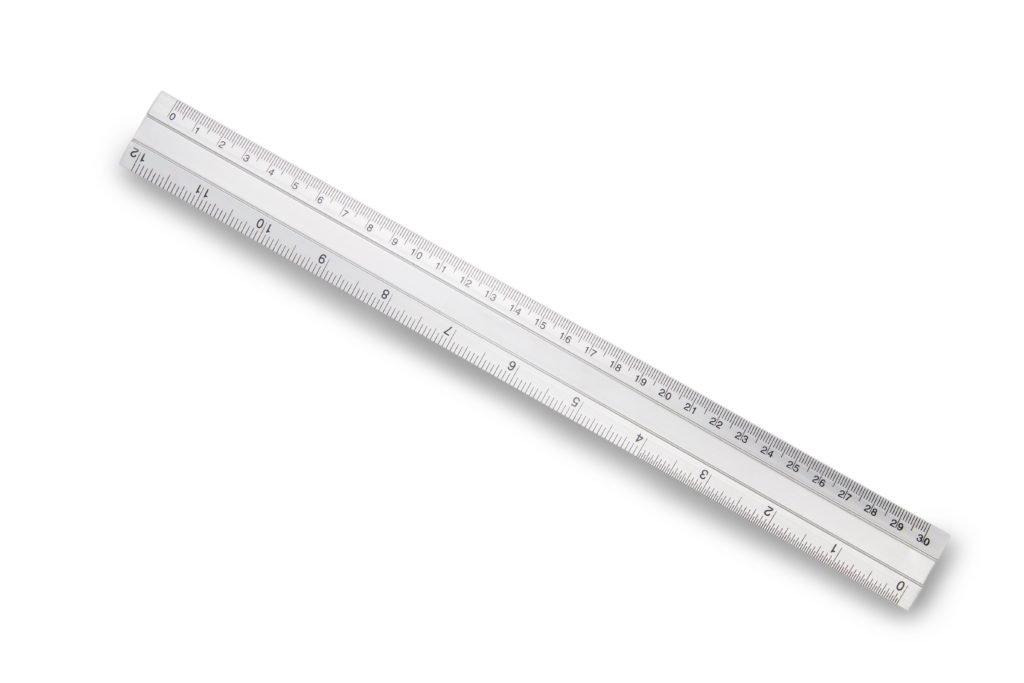
3) Align the scale with the distance – Place a ruler, straight edge, or the edge of a piece of paper between the two points you want to measure.
4) Transfer the distance to the scale – Move the measured length to the graphic scale, aligning one end with the zero mark.
5) Read the measurement – Count the number of major divisions and add any minor subdivisions to determine the total distance.
For partial distances, estimate between subdivisions carefully rather than rounding up or down arbitrarily.
Why Graphic Scales Are Reliable and When to Use Them
One major advantage of graphic scales is their reliability. Because they scale visually with the document, they remain accurate even when maps are resized for printing, scanned, or displayed on different screens.
Graphic scales are preferred over ratio scales in situations where maps may be reproduced at varying sizes, such as classroom materials, reports, or digital documents. They are also ideal for quick field measurements when calculators or conversion tools are unavailable.
Professionals in surveying and civil engineering rely on graphic scales for consistent results. Landowners and developers use them to estimate distances and property features accurately.
Common Errors and Tips for Accurate Measurement
Despite their simplicity, graphic scales can still be misused. One common error is misreading the units, especially when multiple scales are shown on the same map. You should be sure to verify which scale applies to your measurement.
Another frequent mistake is poor alignment, such as measuring at an angle or using a warped ruler.
Conclusion
Learning how to read a graphic scale is a fundamental skill for anyone who works with maps, plans, or spatial data. Graphic scales provide a clear, reliable way to measure real-world distances without complex calculations, making them an essential tool in many fields.
By understanding the basics of how graphic scales work, recognizing units and divisions, and following a step-by-step measurement process, you can interpret maps with greater confidence and accuracy. Avoiding common mistakes further enhances your precision and reliability.