A topographic map is one of the most valuable tools for anyone who needs to understand the shape and elevation of the land such as engineers and surveyors.
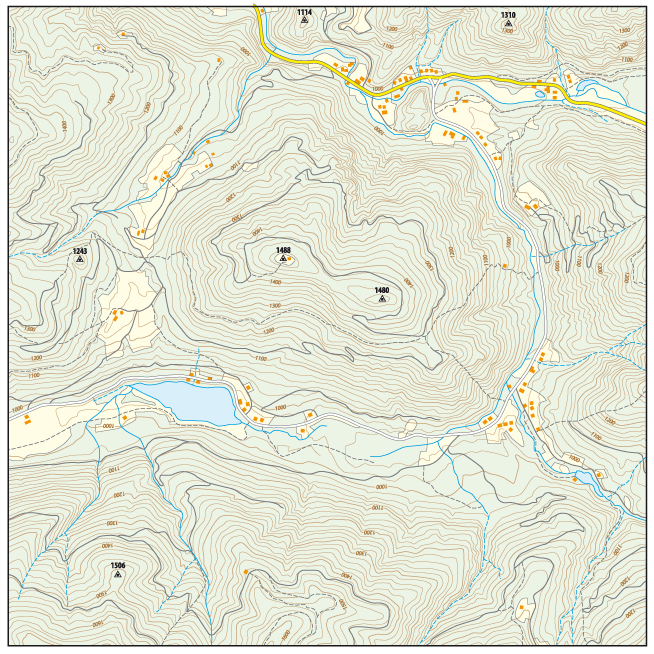
At the heart of these maps are contour lines, the curved lines that trace the landscape’s highs and lows. These lines transform a flat map into a three-dimensional picture, allowing readers to visualize hills, valleys, slopes, and depressions with remarkable accuracy.
Contour lines are essential for understanding how terrain changes across a given area. By reading them properly, you can determine elevation, slope steepness, and landform types. This information is crucial in construction planning, land development, and the prevention of floods.
This article will explore what contour lines are, how to read them, what their shapes mean, and why they are indispensable for interpreting a topographic map.
Understanding the Purpose of Contour Lines
Contour lines represent elevation on a map. Each contour line connects points that are at the same height above sea level. This means that if you were to walk along a contour line in real life, you would stay at exactly the same elevation the entire way.
Because topographic maps are two-dimensional, contour lines provide a way to visualize three-dimensional landforms. When you look at a topographic map filled with these lines, you are essentially seeing a side view of the landscape represented from above. The tighter and denser the lines, the steeper the land; the more spaced out they are, the flatter the terrain.
This concept allows surveyors, geologists, and land planners to analyze land shapes without physically being there. Whether they are for designing roads or planning drainage systems, contour lines give a precise understanding of how elevation changes across the land.
Contour lines make it possible to see the rise and fall of the surface of the Earth on a flat piece of paper.
Reading Elevation and Slope from Contour Lines
To fully understand contour lines, you need to learn how to read elevation and slope. The key lies in the contour interval, which is the vertical distance between two adjacent contour lines. This interval is consistent throughout a map and is usually listed in the map’s legend (for example, a contour interval of 20 feet means each line represents a 20-foot change in elevation).
Here is how contour lines reveal the shape of the terrain.
Close spacing between contour lines indicates a steep slope. This might represent a hill, cliff, or mountainside.
Wide spacing shows a gentle slope or flat terrain, such as a plain or valley floor.
Evenly spaced lines suggest a uniform slope, while irregular spacing may indicate rolling hills or uneven ground.
By following the progression of contour lines, you can determine which direction the land rises or falls. Elevation numbers printed along the lines tell you how high or low each contour is. When these numbers increase as you move inward, you’re climbing uphill. When they decrease, you’re descending.
Being able to read slopes from contour lines is vital in many practical contexts from designing road gradients and drainage systems to assessing potential flood zones.
Common Contour Line Patterns and What They Indicate
Contour lines form distinct patterns that reveal the nature of the terrain. By recognizing these patterns, you can quickly interpret the landscape.
Hilltops or Mountains: Concentric closed circles (smaller inside, larger outside) represent a hill or mountain peak. The innermost circle is the highest point.
Depressions or Basins: Closed loops with hachure marks (short lines pointing inward) show a depression, such as a crater or sinkhole.
Ridges: Contour lines that form U- or V-shaped curves pointing away from higher ground indicate a ridge.
Valleys: Contour lines shaped like a “V” that point uphill represent a valley or stream channel. The tip of the “V” usually points upstream.
Cliffs or Escarpments: Contour lines that are extremely close together or touching each other represent a near-vertical slope or cliff.
Learning to recognize these shapes helps you visualize landforms more accurately, even without seeing them in person.
Index Contours, Supplementary Lines, and Elevation Labels
To make contour maps easier to read, mapmakers use several variations of contour lines, each serving a specific purpose.
Index Contours: These are bold or darker lines that appear at regular elevation intervals (for example, every fifth contour line). Each index contour is labeled with its elevation, allowing you to quickly determine the height and estimate the elevation of other lines between them.
Intermediate Contours: The thinner lines between index contours represent smaller elevation changes. They help show more detail in areas with gradual slopes.
Supplementary or Dashed Contours: Used in very flat areas where elevation differences are minimal, these dashed lines represent small variations in terrain that might otherwise go unnoticed.
By using these different line types together, topographic maps achieve both clarity and precision. You can easily calculate elevation differences between points or measure the total relief (difference between the highest and lowest points) in an area.
Practical Uses of Contour Lines
Contour lines have a wide range of practical applications that extend far beyond map reading.
Surveying and Engineering: Surveyors rely on contour maps to plan roads, drainage systems, and building foundations. Engineers use them to design structures that fit the landscape, ensuring proper slope and drainage.
Land Development and Construction: Developers use contour data to determine cut-and-fill requirements, manage stormwater runoff, and evaluate buildable areas on uneven terrain.
Hydrology and Environmental Management: Contour lines help identify watersheds, flood zones, and drainage patterns, making them essential for environmental impact assessments and land conservation efforts.
Conclusion
Contour lines are the foundation of topographic mapping, transforming a flat image into a dynamic representation of the surface of the Earth.
By learning how to interpret contour spacing, shapes, and elevation markings, you gain the ability to analyze landscapes, anticipate slope conditions, and make informed decisions in the field. Whether for surveying, construction, environmental studies, or navigation, contour lines are essential to understanding the geography around us.