A topographic map is one of the most detailed and informative tools used to understand the surface of the Earth.
A topographic map reveals not only where things are located, but also the shape and elevation of the land. It transforms three-dimensional terrain into a two-dimensional format using symbols, contour lines, and colors to represent natural and human-made features.
Topographic maps are indispensable for surveyors, engineers, geologists, and developers. They serve as blueprints for land planning, environmental analysis, and navigation.
This article will present what is shown on a topographic map (from elevation and contour lines to natural features, man-made structures, and coordinate systems) to help you understand how these maps convey a detailed picture of the land.
Understanding Topographic Maps
Topographic maps are designed to represent the three-dimensional landscape (its hills, valleys, slopes, and plains) on a two-dimensional surface. They provide a visual representation of the shape of the Earth using lines, symbols, and colors to indicate changes in elevation and terrain features.
At the core of a topographic map is the concept of elevation, or how high or low a point is relative to sea level. This information is translated through contour lines, which connect points of equal elevation. The closer these lines are to one another, the steeper the terrain; the farther apart they are, the gentler the slope.
Unlike other types of maps, such as road maps which show transportation routes, topographic maps focus on the land’s physical shape and features. They are the primary tools used in surveying and civil engineering.
A topographic map can depict everything from the ruggedness of a mountain range to the flatness of a floodplain, making it essential for land use planning, construction, and resource management.
Elevation and Contour Lines
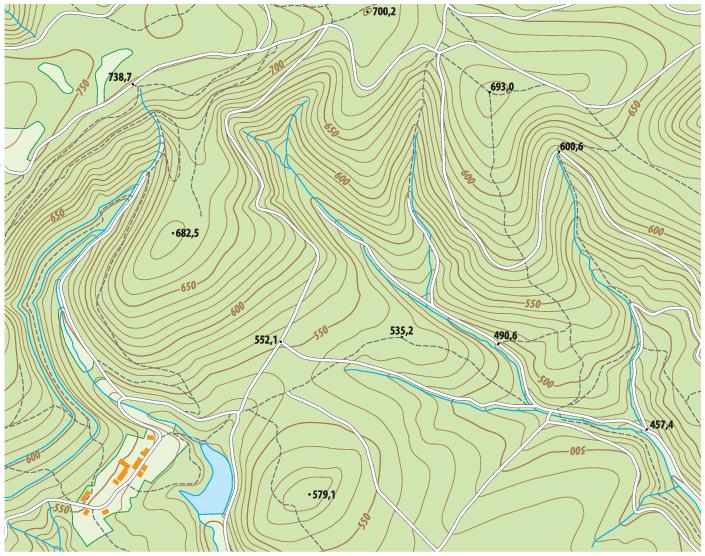
The most defining feature of a topographic map is its contour lines, which illustrate elevation which is the height of the land above sea level. Contour lines connect points of equal elevation, creating a visual pattern that represents the land’s shape and relief.
The following presents how to interpret contour lines.
Contour Interval: This is the vertical distance between contour lines. If the interval is 10 feet, each line represents a 10-foot change in elevation. A smaller interval gives more detail, while a larger interval shows broader features.
Steep vs. Flat Terrain: When contour lines are close together, it means the land is steep. When they’re spaced far apart, the terrain is flat or gently sloping.
Special Contour Patterns:
Closed loops indicate hills or mountains.
Concentric circles with hachure marks (short lines pointing inward) represent depressions or sinkholes.
V-shaped contours pointing uphill show valleys or stream channels, while those pointing downhill indicate ridges.
By studying these patterns, users can visualize the shape of the land — where it rises, falls, or levels out. This information is crucial for construction projects, road design, watershed analysis, and flood prevention planning.
Contour lines essentially give the map its three-dimensional perspective, allowing users to “see” the land’s form without ever setting foot on it.
Natural Land Features
Topographic maps do not just show elevation. They also depict a wide range of natural land features that define the physical environment.
These features include the following.
Water Features: Rivers, streams, lakes, ponds, marshes, and coastlines are shown using blue lines or shaded areas. Flow direction is often indicated by arrows or the shape of the contour lines around the water body.
Vegetation and Forests: Green shading often represents wooded areas or vegetation cover, while white or light tan may indicate open ground, fields, or barren land.
Mountains, Hills, and Valleys: These are represented by the shape and spacing of contour lines. The denser the lines, the more rugged the terrain.
Drainage Patterns: By examining the contours and water features, you can identify natural drainage basins, watersheds, and flood-prone areas.
Natural features on topographic maps are critical for understanding soil erosion, wildlife habitats, flood risks, and environmental conservation. For developers and planners, this data helps determine where it is feasible or safe to build.
Human-Made Features
In addition to showing nature’s contours, topographic maps also display human-made structures and boundaries, making them powerful tools for understanding how people interact with the land.
Common man-made features on topographic maps include the following.
Roads and Highways: Displayed using different line styles depending on road type (solid or dashed lines for major and minor roads).
Buildings and Urban Areas: Individual structures or shaded zones indicate built-up areas.
Railroads and Airports: Marked by specialized symbols, often with accompanying labels.
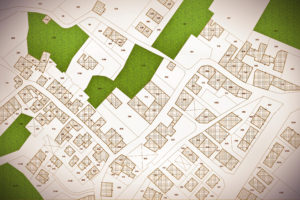
Boundaries: Property lines, political boundaries, and subdivision borders are often delineated using dashed or dotted lines.
Utilities and Infrastructure: Symbols for pipelines, power lines, dams, bridges, and canals are frequently shown.
These symbols are standardized by mapping agencies like the U.S. Geological Survey (USGS) to ensure consistency across all maps.
For surveyors and engineers, the ability to see both natural and artificial features on a single map helps with project planning, site selection, and compliance with zoning and environmental regulations. For landowners, these maps provide valuable insight into property layout and nearby infrastructure.
Coordinate Systems, Scale, and Orientation
To accurately interpret and use a topographic map, it is important to understand three key elements: map scale, coordinate systems, and orientation.
Map Scale:
The scale indicates how much real-world distance is represented on the map. For example, a 1:24,000 scale means 1 inch on the map equals 24,000 inches (2,000 feet) on the ground. Smaller scales cover larger areas with less detail, while larger scales show smaller areas with greater precision.
Coordinate Systems:
Topographic maps use coordinate systems such as:
Latitude and Longitude: Based on the geographic grid of the Earth, ideal for global positioning.
Universal Transverse Mercator (UTM): Uses metric grid coordinates for high accuracy in local and regional mapping.
State Plane Coordinate System (SPCS): Commonly used in U.S. land surveying and engineering.
Orientation and North Indicators:
Every topographic map includes a north arrow or compass rose, along with grid lines that help orient the map correctly. The legend explains symbols and colors, while the scale bar allows for quick distance estimation.
Understanding these components ensures you can locate exact positions, calculate distances, and align the map with real-world directions.
Conclusion
A topographic map is a comprehensive visual record of both natural and man-made features that define a landscape. By combining elevation contours, natural formations, human infrastructure, and coordinate systems, these maps provide a multidimensional understanding of the surface of the Earth.
Topographic maps are indispensable for surveyors, developers, architects, and engineers who rely on precise geographic information. They help with land planning, resource management, and environmental assessment.
Learning how to read and interpret topographic maps allows you to visualize terrain, anticipate challenges, and make informed decisions about land use.