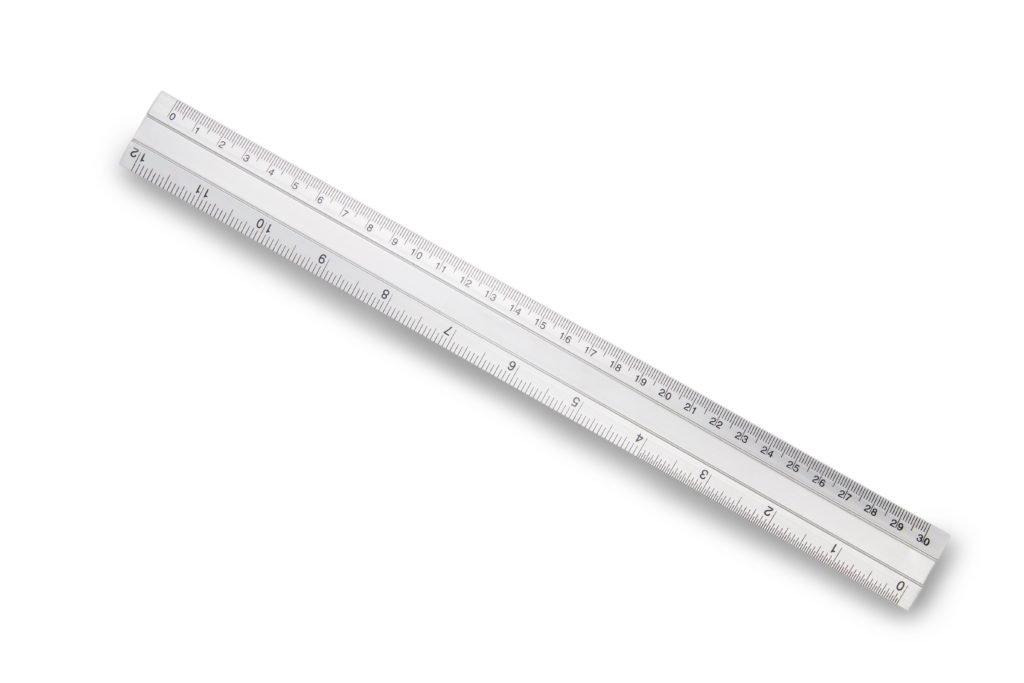
A graphic scale is a visual representation of distance that appears as a line or bar, divided into segments, showing the relationship between distances on a drawing or map and real-world measurements. Unlike written or ratio scales, a graphic scale allows users to measure distances directly without calculations.
Graphic scales are essential tools in map reading, surveying, architecture, and engineering. They help ensure accuracy when interpreting distances and remain reliable even if a document is resized or reproduced.
This article explains where graphic scales are commonly found and why they are important in each of those settings.
Graphic Scales on Maps
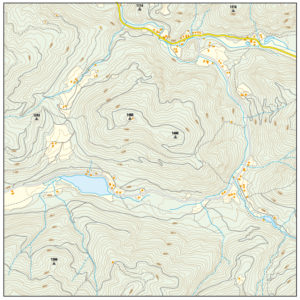
Graphic scales are most commonly found on maps of all types. Topographic maps, road maps, and thematic maps frequently include a graphic scale to help users determine distances between locations.
One key advantage of a graphic scale on a map is that it remains accurate even if the map is enlarged or reduced. As long as the scale bar changes size proportionally with the map, it continues to represent correct distances.
Graphic scales on maps provide a simple and reliable way to understand spatial relationships.
Graphic Scales on Engineering and Surveying Drawings
Graphic scales are also widely used on engineering and surveying drawings, including site plans, grading plans, and utility layouts. These drawings often represent large areas at reduced sizes, making accurate distance interpretation essential.
Surveyors include graphic scales to ensure that measurements remain accurate even if drawings are printed at different sizes. This is especially important when plans are shared digitally or reproduced multiple times.
In engineering applications, graphic scales help contractors and designers quickly estimate distances, verify dimensions, and understand spatial relationships without relying solely on written scales.
Graphic Scales in Architectural Plans
Architectural plans commonly feature graphic scales alongside written scales to help builders, inspectors, and designers interpret dimensions accurately.
A graphic scale ensures that measurements taken from architectural plans remain consistent regardless of reproduction size. This reduces the risk of misinterpretation during construction.
Graphic scales also improve usability by allowing users to measure directly from the drawing.
Graphic Scales in Reference Materials
Graphic scales are often found in reference materials such as textbooks and atlases.
Historical maps and reference publications also rely on graphic scales, particularly when original ratio scales may no longer be accurate due to reproduction or aging. The graphic scale preserves the map’s usability over time.
Digital and Online Uses of Graphic Scales
In modern applications, graphic scales appear in digital mapping platforms and GIS software. Online maps, satellite imagery, and interactive tools often display a dynamic scale bar that adjusts as users zoom in or out.
These digital graphic scales allow users to measure distances accurately on screens of different sizes and resolutions. As the map view changes, the scale updates automatically to reflect the current zoom level.
Conclusion
Graphic scales are found in a wide range of contexts, from maps and engineering drawings to architectural plans and digital mapping platforms. Their versatility and reliability make them indispensable tools for accurate distance measurement.
By understanding where graphic scales are used and how they function, users can interpret drawings and maps with confidence and precision.
Whether in traditional paper formats or modern digital applications, graphic scales continue to play a vital role in mapping, design, and planning.